04 May Beyond the Molecule: Can the Hydrogen Spectrum Solve Our Energy Equity Crisis?
Over 95% of global hydrogen today is grey, produced from fossil gas, emitting 9–12 kg of CO₂ per kilogram of hydrogen, with pollution burdens falling disproportionately on low-income communities surrounding industrial plants. The global South produces less than 5% of the world’s hydrogen and cannot afford to import it at current prices. Meanwhile, sectors responsible for nearly 30% of global CO₂ emissions such as steel, shipping, ammonia, heavy industry that have no viable decarbonization pathway without it. Hydrogen is not optional. But its current form is inequitable, and scaling the wrong version of it will entrench that inequity for decades.
The colour of hydrogen determines not just its carbon footprint, but who gets access, and who bears the transition costs. Green hydrogen could turn solar-rich nations in the Global South into clean energy exporters for the first time. Blue hydrogen can protect livelihoods in fossil-dependent industrial regions by decarbonizing without dismantling existing infrastructure. Pink hydrogen offers baseload clean energy for nations with legacy nuclear assets. Grey hydrogen, left unregulated, continues to externalize its costs onto the communities least able to absorb them.
This report examines all four hydrogen pathways through the lens of Levelized Cost of Hydrogen (LCOH), projecting cost trajectories through 2030 and identifying the conditions under which each pathway becomes viable. The goal is not to declare a winner, but to provide a clearer picture of the trade-offs – economic, environmental, and social, that policymakers, investors, and communities will need to navigate in the years ahead.
Sources: IEA Global Hydrogen Review 2024; ScienceDirect techno-economic analyses (2024–2025); Aras Energy (2025)
Grey hydrogen: the burden we've inherited
Grey hydrogen is today’s default and its biggest problem. Produced from natural gas through steam methane reforming (SMR), it dominates global supply purely on cost. Over 95% of global hydrogen production is grey, releasing between 10 and 19 tonnes of CO₂ per tonne of hydrogen.
Key facts:
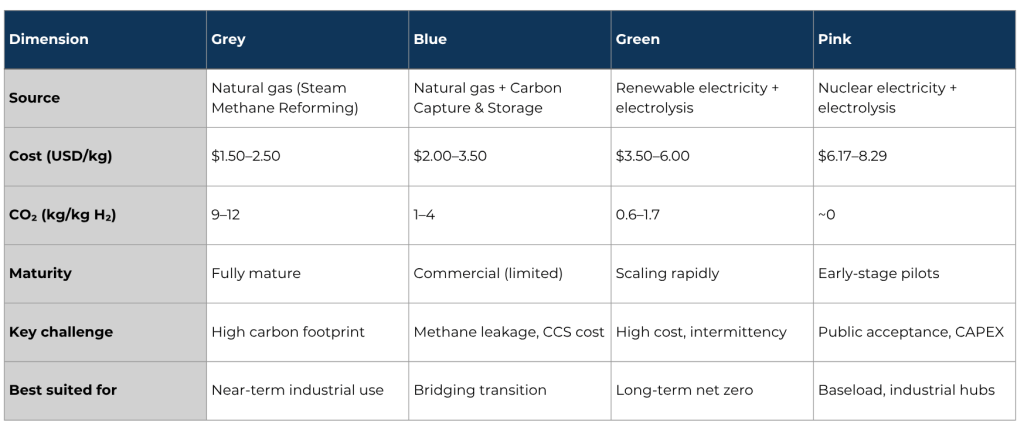
- Cost: approximately USD 1.50–2.50/kg; the cheapest available today
- Emissions: for every tonne of hydrogen produced, up to 10 tonnes of CO₂ are emitted roughly three times the emissions of burning an equivalent volume of gasoline
- Infrastructure: fully mature, with well-established pipelines and storage globally
- Regulatory headwind: rising carbon taxes are beginning to erode its cost advantage
Where it works best:
- Large-scale industrial processes already locked into natural gas infrastructure (refineries, fertilizer plants, petrochemicals)
- Regions with low natural gas prices and no carbon pricing mechanism
- Short-term hydrogen demand where cost is the primary constraint
Challenges to watch:
- Carbon taxes and emissions regulations will increasingly erode its cost advantage
- Stranded asset risk as decarbonisation policies tightens through the 2030s
- Incompatible with net-zero commitments, no viable pathway to clean without Carbon Capture and Storage addition
Emissions from grey hydrogen production contribute to air quality degradation and climate change; costs borne disproportionately by communities nowhere near the production site. Grey hydrogen is not a villain; it is a legacy the world can no longer afford to maintain without a transition plan.
Blue hydrogen: a bridge, not a destination
Blue hydrogen applies carbon capture and storage (CCS) to the same natural gas process as grey, trapping emissions before they reach the atmosphere. It is the most realistic near-term option for heavy industry operating within existing gas infrastructure.
Key facts:
- Cost: USD 2.00–3.50/kg, with reductions dependent on CCS efficiency and natural gas price volatility Aras Energy
- Emissions: 1 to 4 tonnes of CO₂ per tonne of hydrogen which is a significant reduction from grey, but dependent on high CCS capture rates and tight methane leakage control Belfer Center for Science and International Affairs
- Status: low-emissions hydrogen (blue + green combined) reached approximately 1 Mt/year in 2025, still under 1% of global production Aras Energy
- Policy driver: US Inflation Reduction Act production tax credits of up to USD 3.00/kg are improving blue hydrogen’s cost position
Where it works best:
- Industrial hubs with existing gas pipelines and proximity to geological CO₂ storage sites
- Countries with large natural gas reserves seeking a lower-carbon transition (US, Norway, Gulf states)
- Hard-to-abate sectors needing a near-term emissions reduction bridge such as steel, cement, chemicals
Challenges to watch:
- Methane leakage upstream can silently wipe out the carbon benefit — even small leakage rates matter significantly
- CCS infrastructure is expensive, geographically constrained, and still unproven at full scale
- Competitive window narrows fast if green hydrogen costs fall faster than expected, or if carbon pricing rises sharply
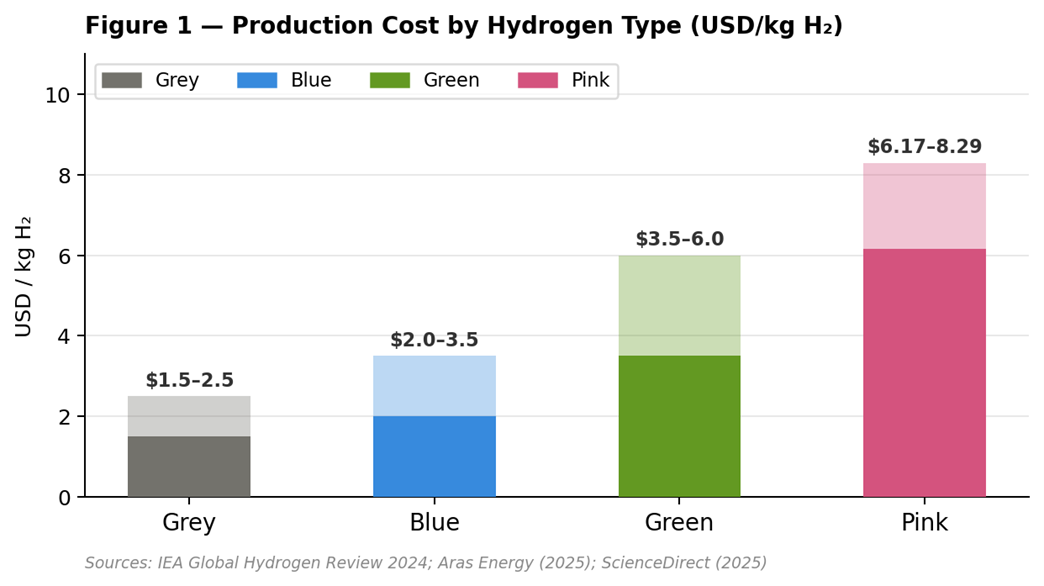
Figure 1 — Mid-point cost ranges (USD/kg H₂): Grey $1.50–2.50 | Blue $2.00–3.50 | Green $3.50–6.00 | Pink $6.17–8.29. Sources: IEA 2024; Aras Energy 2025; ScienceDirect 2025
Green hydrogen: the goal the world is racing toward
Green hydrogen is produced by splitting water via electrolysis, powered entirely by renewable electricity like wind, solar, or hydro. No carbon is emitted anywhere in the process. Lifecycle assessments confirm emissions as low as 0.6 kg CO₂-equivalent per kilogram of hydrogen when wind power is used: roughly twenty times cleaner than grey.
Key facts:
- Cost today: USD 3.50–6.00/kg, falling fast
- International Energy Agency projects green hydrogen costs could halve by 2030, reaching USD 2–9/kg under net-zero-aligned deployment scenarios IEA
- Electrolyser production grew 60% year-on-year in 2024; China leads with 60% of global manufacturing capacity, achieving costs 40–45% below European and US levels Gh2
- Green hydrogen production is projected to surpass blue from approximately 2042 onwards, with a steeper long-term growth trajectory MDPI
- Announced electrolyser projects total nearly 520 GW of capacity globally, with final investment decisions doubling year-on-year to 3.4 Mtpa IEA
Where it works best:
- Regions with abundant, cheap renewable electricity such as solar belts, coastal wind corridors, hydro-rich nations
- Export-oriented energy economies (Australia, Chile, Morocco, India) building long-term clean fuel supply chains
- Sectors that need zero-carbon hydrogen as a feedstock — green ammonia, green steel, sustainable aviation fuel
Challenges to watch:
- Still too expensive in most regions without subsidies — cost parity with grey is not expected broadly until late 2020s to early 2030s
- Intermittency of renewables means electrolyser utilisation rates are lower, pushing up per-kg costs
- Massive water consumption in water-scarce regions is an underappreciated constraint
- Transmission and storage infrastructure for hydrogen at scale is largely yet to be built
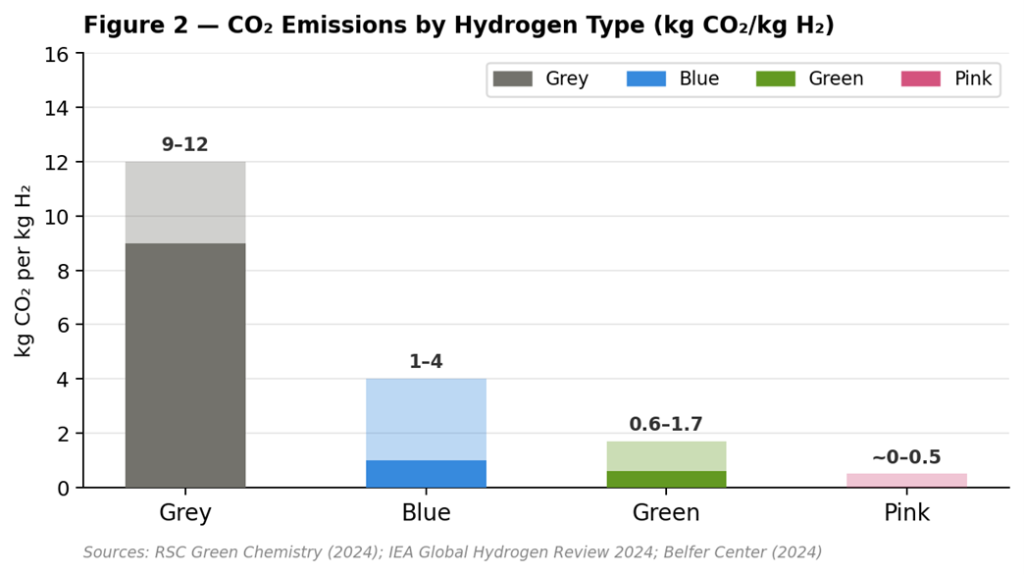
Figure 2 — Mid-point lifecycle CO₂ (kg/kg H₂): Grey 10.5 | Blue 2.5 | Green 1.1 | Pink 0.2. Sources: RSC Green Chemistry 2024; IEA 2024; Belfer Center 2024
Pink hydrogen: the baseload clean alternative
Pink hydrogen uses the same electrolysis process as green hydrogen but is powered by nuclear electricity rather than renewables. Because nuclear plants generate electricity continuously, it can produce hydrogen at a steady, predictable rate which is a key advantage over weather-dependent renewables.
Key facts:
- Global pink hydrogen market valued at USD 27 billion in 2024; projected to reach USD 287 billion by 2033, growing at a CAGR of over 30%
- Current levelized cost: USD 6.17–8.29/kg, with scenario analysis pointing to USD 4.73–6.25/kg by 2030–2035 as small modular reactor (SMR) technology matures ScienceDirect
- In subsidized scenarios in the United States, pink hydrogen from fully depreciated nuclear plants can reach production costs below USD 2/kg pv magazine
- Emissions: near-zero operational CO₂, comparable to green hydrogen on a lifecycle basis
- Alkaline electrolysis dominates the production process with a 68% market share in 2024, owing to its technological maturity and lower capital cost relative to other electrolysis types
Where it works best:
- Countries with existing nuclear infrastructure such as France, South Korea, Finland, the United States can produce clean hydrogen without new land-intensive renewable buildout
- Industrial applications requiring uninterrupted, high-volume hydrogen supply (steel, ammonia, refining)
- Energy-dense, space-constrained nations where utility-scale solar or wind is impractical
Challenges to watch:
- High upfront capital costs for both nuclear plants and electrolysers
- Public concerns around nuclear safety and waste disposal remain a genuine barrier to social license
- Regulatory frameworks for what qualify as “clean” nuclear hydrogen remain inconsistent across regions
Why LCOH Matters: The True Cost of Clean Hydrogen
The numbers in this analysis use Levelized Cost of Hydrogen (LCOH) the most rigorous metric for comparing hydrogen pathways. Unlike simple production costs, LCOH captures the full economic reality: capital investment amortized over decades, financing costs, operational expenses, capacity factors, and feedstock prices. It answers the question every investor, policymaker, and industrial buyer actually asks: what minimum price must I charge per kilogram to break even over the project’s lifetime?
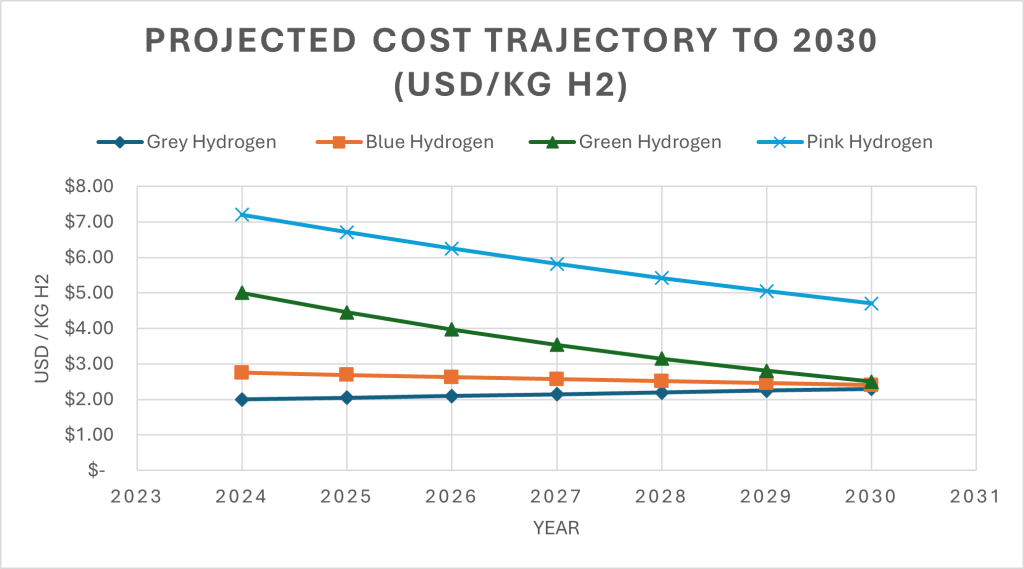
Figure 3 — Projected LCOH (USD/kg): Green approaches grey/blue cost parity by ~2030. Sources: IEA NZE Scenario 2024; ScienceDirect (2025)
Projected LCOH (USD/kg), 2024–2030
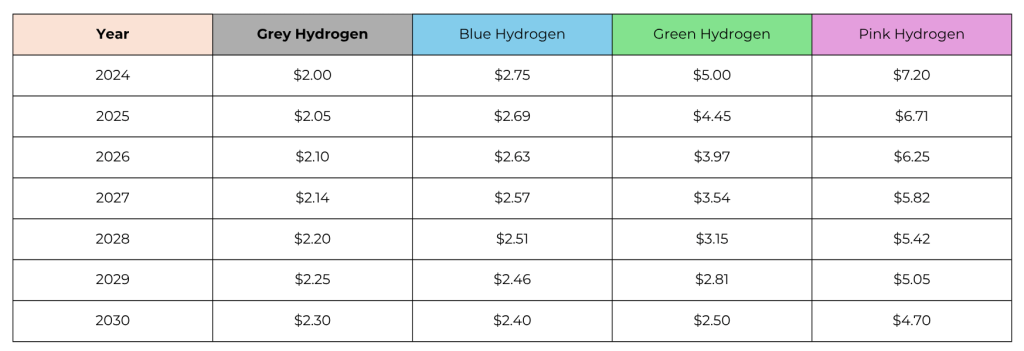
Sources: IEA Global Hydrogen Review 2024; ScienceDirect (2025)
The Four Dimensions of Hydrogen Equity: A Strategic Framework
Hydrogen’s cost trajectory tells only part of the story. The other part is about who bears the cost when hydrogen is produced cheaply, who gains when it becomes clean, and who gets left behind if the transition moves faster than communities can absorb.
Four equity dimensions cut across all four hydrogen pathways:
- Access
Falling green hydrogen costs mean little if the financing mechanisms, supply chains, and technology transfer required to deploy electrolysers in the Global South do not materialize. Cost parity at a global average obscures the reality that a farmer in Rajasthan and a chemical plant in Rotterdam face entirely different hydrogen economics. - Employment
Blue hydrogen’s value in gas-dependent industrial regions is as much about preserving livelihoods as reducing emissions. Pink hydrogen’s relevance in countries with legacy nuclear infrastructure is partly about retaining skilled workforces that a renewables-only transition would otherwise displace. The speed of decarbonization matters as much as the destination.
- Environmental burden
Grey hydrogen’s low cost has always been subsidized by the communities surrounding fossil fuel infrastructure — through air quality, health outcomes, and land use impacts that do not appear in any LCOH calculation. Pricing carbon addresses part of this gap. The rest requires deliberate siting policy and enforceable emissions standards.
- Sovereignty
There is a material difference between a country that builds its own green hydrogen supply chain and one that simply switches from importing oil to importing hydrogen. One builds long-term energy independence. The other recreates dependency in a new form.
These dimensions do not change the numbers in the cost tables. But they change what the numbers mean, and they are the reason the colour of hydrogen carries consequences well beyond chemistry.
The Path Forward: No Single Colour Wins
The hydrogen ‘rainbow’ is more than a map of chemical processes; it is a blueprint for a global reset. As we look toward 2030 and beyond, it is clear that no single color holds the absolute key to our energy future. Instead, the solution lies in a strategic orchestration of all four.
The Grey legacy reminds us of the scale of the challenge we must overcome. Blue serves as the vital economic bridge, ensuring that the transition to net-zero doesn’t come at the cost of community stability and industrial livelihoods. Pink offers the unshakeable foundation of reliability, proving that deep decarbonization and energy security can coexist. Finally, Green represents the ultimate goal: a world where energy is not just clean, but democratized, allowing regions once left behind to lead the charge.
At the Frost & Sullivan Institute, we believe that the true success of the hydrogen economy will not be measured in megatonnes produced, but in the lives improved. It will be measured in the cleaner air breathed by children in industrial corridors, the preservation of high-skilled jobs in transitioning regions, and the newfound energy independence of developing nations.
The color of hydrogen we prioritize today determines the world we inhabit tomorrow. By embracing this spectrum of innovation, we aren’t just fueling engines; we are fueling a future that is resilient, equitable, and sustainable for all.
Full references: IEA Global Hydrogen Review 2024; RSC Green Chemistry (2024); ScienceDirect (2024–2025); Aras Energy (2025); Green Hydrogen Organisation (2025); Belfer Center Harvard Kennedy School (2024); MDPI (2025); Lazard/Roland Berger (2023)